Marquette University Law School Poll released a new statewide poll on Wednesday, June 22nd. Below, please find a summary of the survey’s results.
Quick Hits on the Poll
 President Joe Biden Favorability -12%
- Favorability 42% (Was 44% in April poll)
- Unfavorability 54% (Was 52% in April poll)
President Joe Biden Job Approval -17%
- Approve 40% (Was 43% in April. poll)
- Disapprove 57% (Was 53% in April poll)
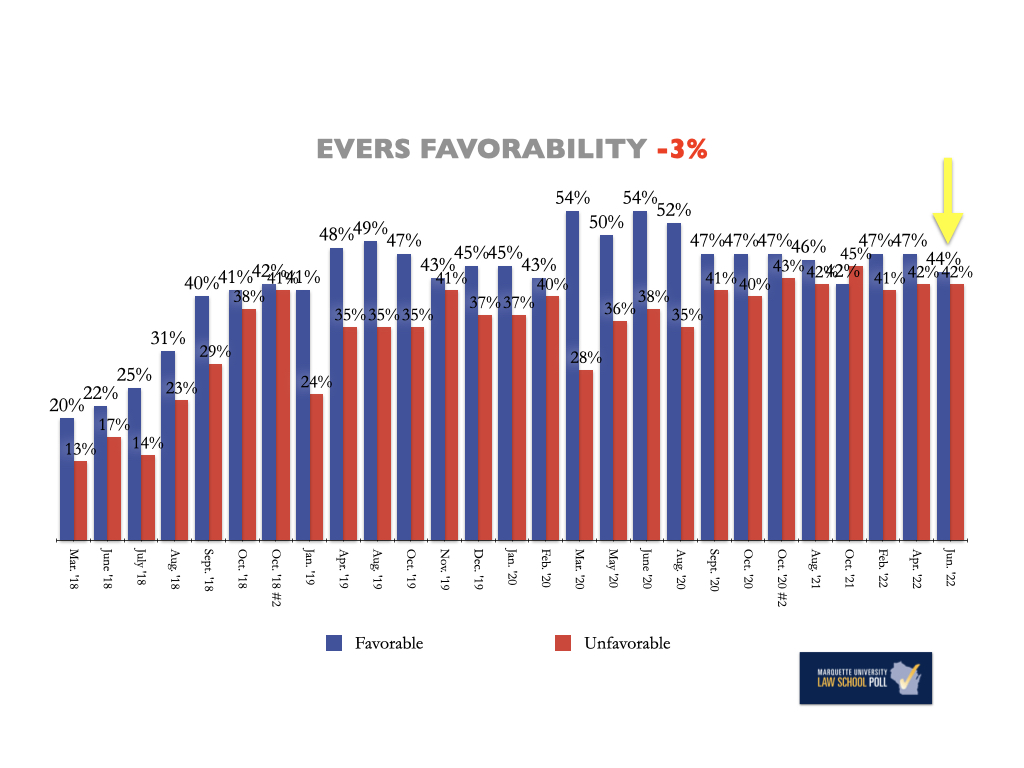
 Governor Tony Evers Favorability +2%
- Favorability 44% (Was 47% in April poll)
- Unfavorability 42% (Was 42% in April poll)
Governor Tony Evers Job Approval +3%
- 48% Approve (Was 49% in April poll)
- 45% Disapprove (Was 43% in April poll)
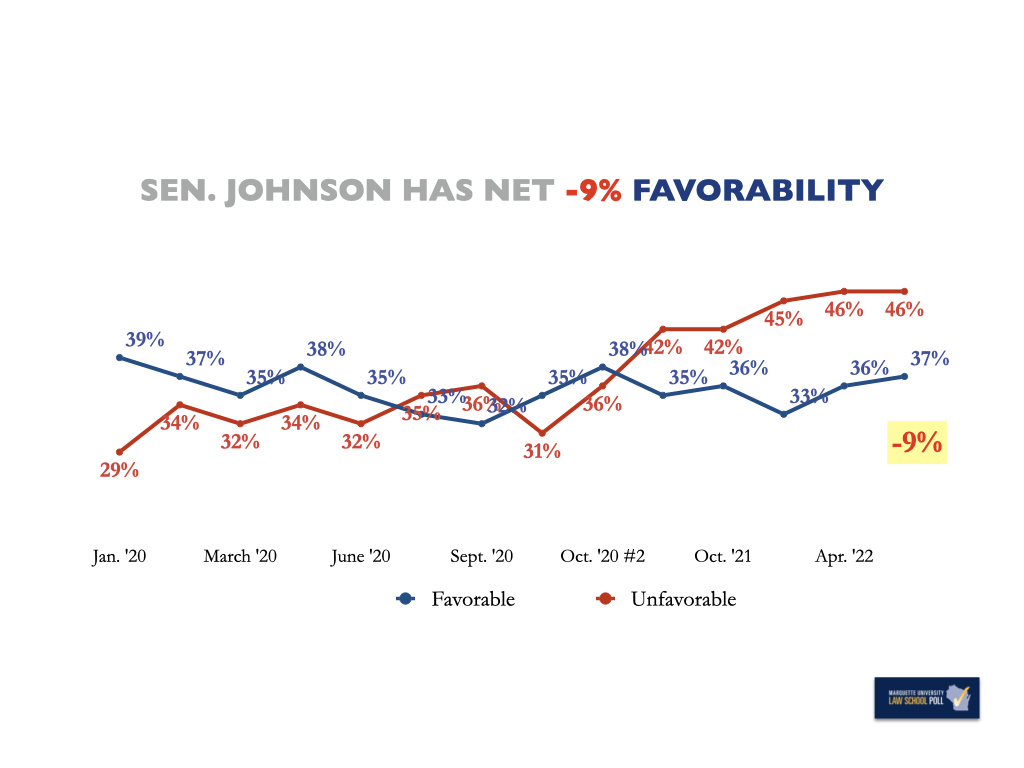
 Sen. Ron Johnson Favorability -9%
Note: 16% of Registered Voters did not register an opinion
- Favorability 37% (Was 36% in April poll)
- Unfavorability 46% (Was 46% in April poll)
 Sen. Tammy Baldwin Favorability +2%
Note: 24% of Registered Voters did not register an opinion
- Favorability 39% (Was 43% in April poll)
- Unfavorability 37% (Was 36% in April poll)
Background on the Survey
 Marquette University Law School released their June poll this Wednesday. Below, please find the methodology of the poll as released by the Law School in their press release:
About the Marquette Law School Poll
The poll interviewed 803 registered Wisconsin voters by landline or cell phone between June 14-20, 2022. The margin of error is +/- 4.3 percentage points for the full sample.
The partisan makeup of the sample, including those who lean to a party, is 45% Republican, 44% Democratic, and 10% independent. Excluding those who lean to a party, the partisan makeup of the sample is 30% Republican, 29% Democratic and 41% independent.
Complete results can be found here:
National Politics
President Joe Biden Favorability -12%
- Favorability 42% (Was 44% in April poll)
- Unfavorability 54% (Was 52% in April poll)
President Joe Biden Job Approval -17%
- Approve 40% (Was 43% in April. poll)
- Disapprove 57% (Was 53% in April poll)
President Joe Biden
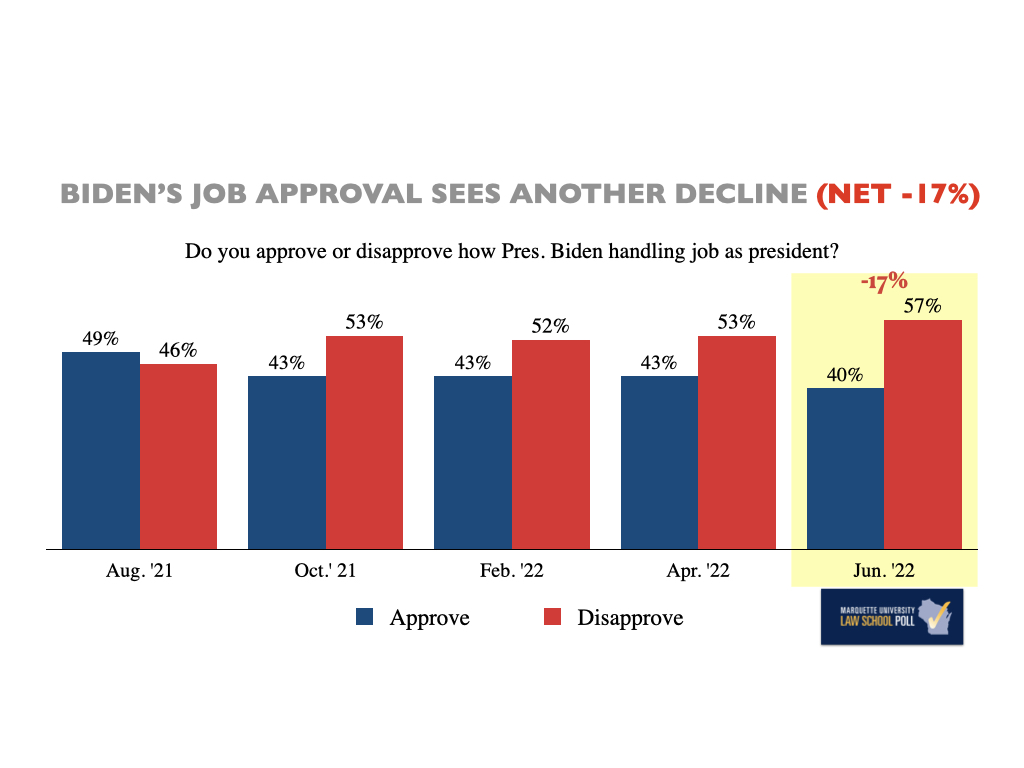
The MU Law School Poll found that 40% of registered voters approve of the way Joe Biden is handling his job as president, and 57% disapprove of the way he is handling his job, a net -17% in job approval.
For comparison, in the last MU Law School survey in April 2022, 43% of registered voters approved of the job the president was doing and 53% disapproved of the way he was handling the job, a net -10% approval.
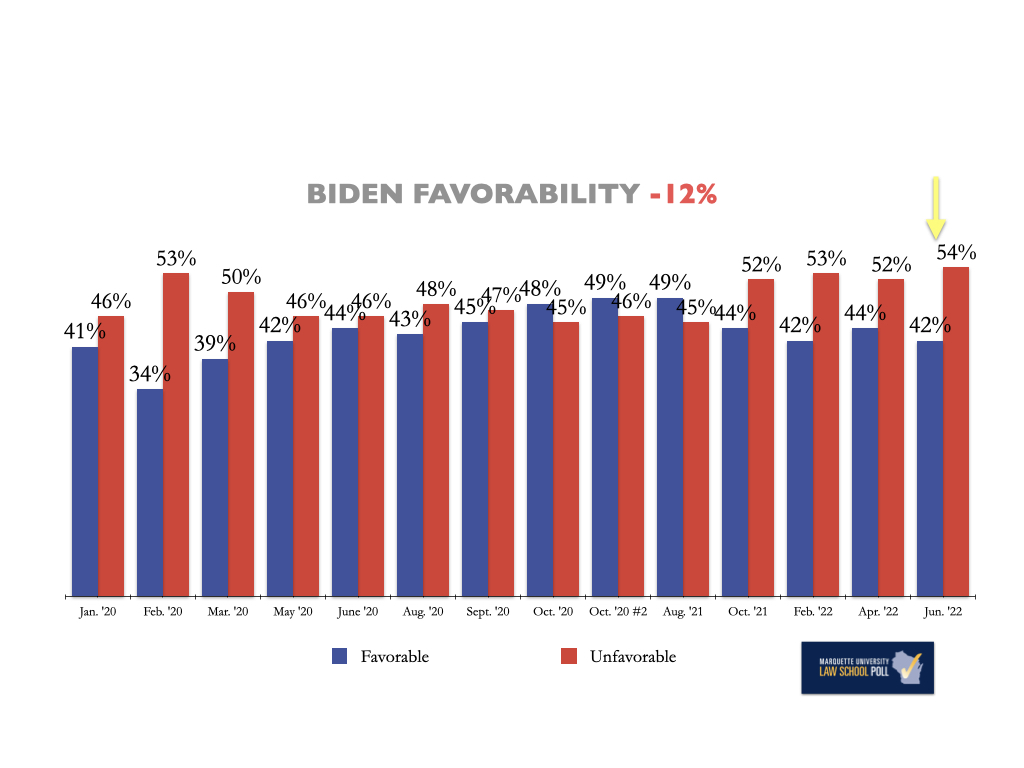
President Biden’s personal favorability tracks very similar to his job approval with 42% of registered voters having a favorable opinion of him and 54% having an unfavorable opinion of him, a net -12% favorability. Those numbers are slightly better than the April poll which found that 44% of registered voters had a favorable opinion of the President and 52% had an unfavorable opinion, a net -8% favorability.
Among voters who identified as Democratic or leaning Democratic, Biden is viewed favorably by 82% and unfavorably by 12%. Independents were 27% favorable and 65% unfavorable, while Republicans were 6% favorable and 93% unfavorable.
President Donald Trump Favorability -17%
- Favorability 39% (Was 36% in Feb. poll)
- Unfavorability 56% (Was 58% in Feb. poll)
Trump Favorability
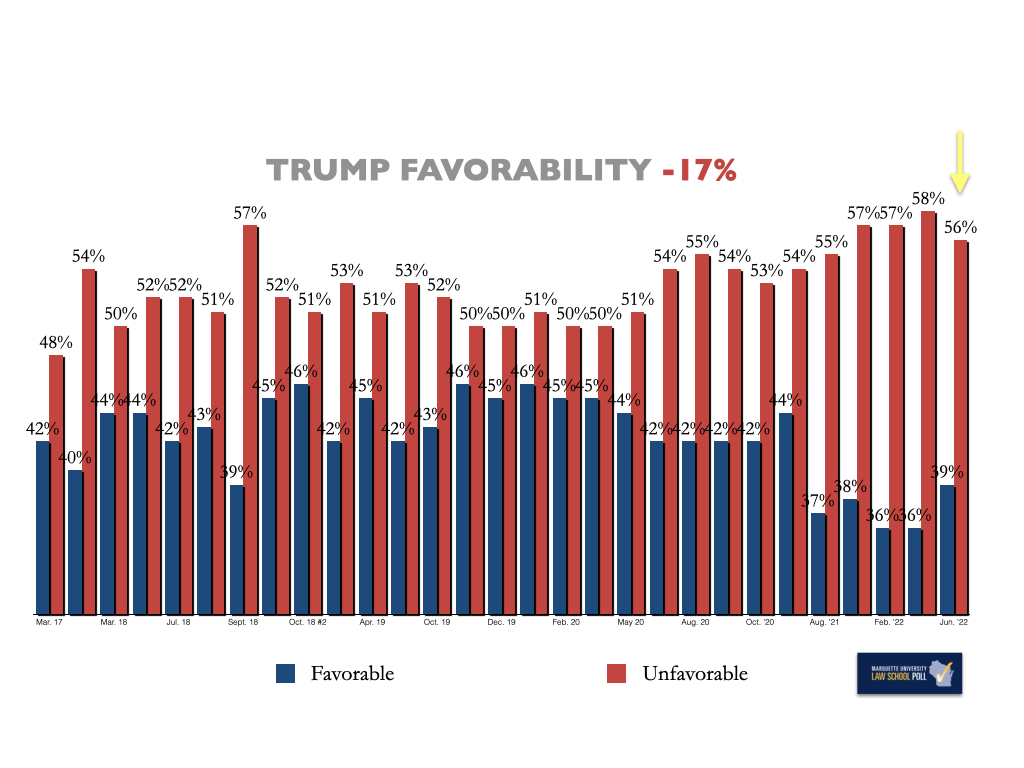
President Biden’s -12% net favorability is slightly better than former President Trump’s favorability, which now sits at a -17% net favorability in the latest poll.
Among voters who identified as Republican or leaning Republican, Trump is viewed favorably by 75% and unfavorably by 19%. Independents were 28% favorable and 64% unfavorable, while Democrats were 5% favorable and 93% unfavorable.
Congress
Sen. Ron Johnson Favorability -9%
Note: 16% of Registered Voters did not register an opinion
- Favorability 37% (Was 36% in April poll)
- Unfavorability 46% (Was 46% in April poll)
US Senator Ron Johnson (R-Oshkosh):
37% of registered voters have a favorable opinion of Republican US Senator Ron Johnson and 46% have and unfavorable opinion of him. Sen. Johnson’s -9% favorability is a slight improvement from his -10% favorability (36% favorable-46% unfavorable) in the April 2022 survey.
About 69% of Republicans and leaning Republicans said they had a favorable opinion of Johnson, compared to 36% of Independents and 5% of Democrats and leaning Democrats.
About 13% of Republicans and leaning Republicans said they had an unfavorable opinion of Johnson, compared to 43% of Independents and 81% of Democrats and leaning Democrats.
Sen. Tammy Baldwin Favorability +2%
Note: 24% of Registered Voters did not register an opinion
- Favorability 39% (Was 43% in April poll)
- Unfavorability 37% (Was 36% in April poll)
U.S. Senator Tammy Baldwin (D-Madison):
39% of registered voters have a favorable opinion of Democratic US Senator Tammy Baldwin and 37% have and unfavorable opinion of her. Sen. Baldwin’s +2% favorability is a noticeable drop from her net +7% favorability (43% favorable-36% unfavorable) in the April 2022 survey.
About 70% of Democrats and leaning Democrats said they had a favorable opinion of Baldwin, compared to 35% of Independents and 10% of Republicans and leaning Republicans.
About 10% of Democrats and leaning Democrats said they had an unfavorable opinion of Baldwin, compared to 39% of Independents and 62% of Republicans and leaning Republicans.

Policy Issues
How concerned are you about…
*Respondents who lean towards a party are considered partisans
…inflation and higher prices?
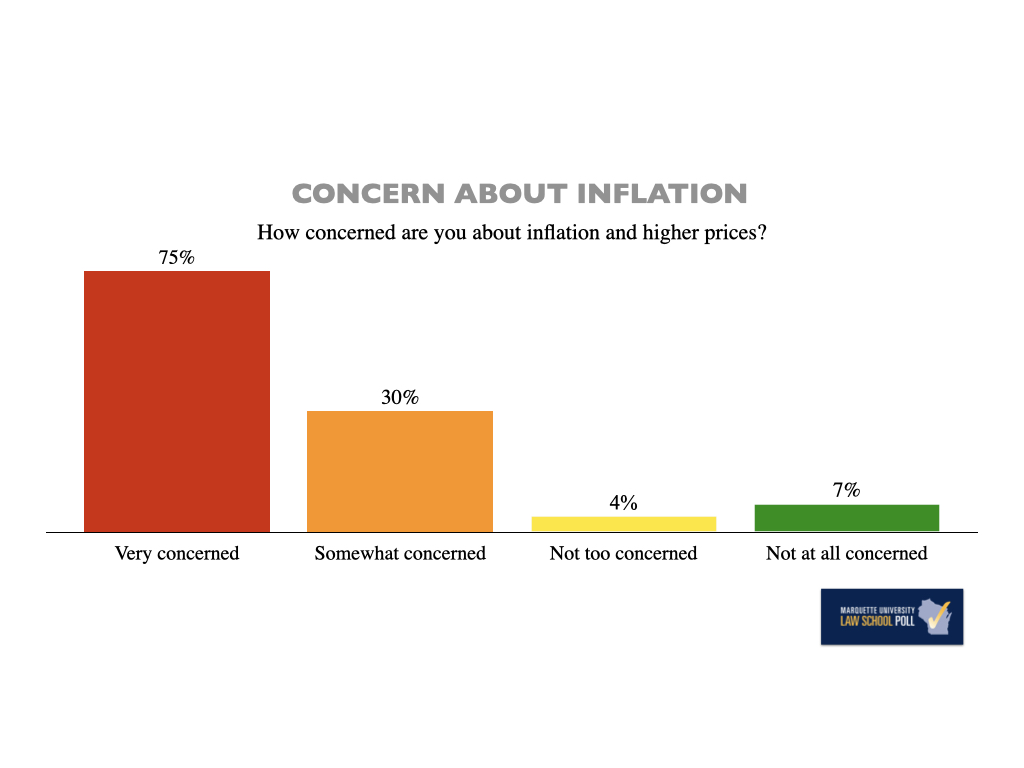
- Very concerned: 75% (GOP: 92% | Independents: 79% | Dems: 55%)
- Somewhat concerned: 20% (GOP: 8% | Independents: 18% | Dems: 34%)
- Not too concerned: 4% (GOP: 0% | Independents: 3% | Dems: 9%)
- Not at all concerned: 1% (GOP: 0% | Independents: 0% | Dems: 1%)
..abortion policy?
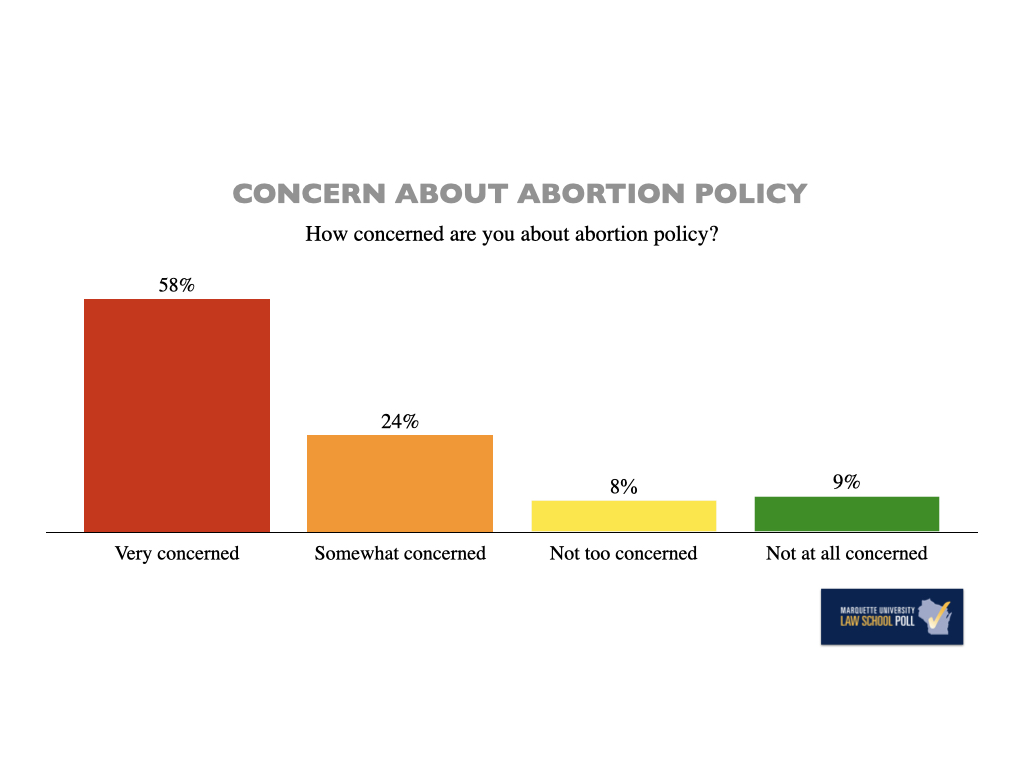
- Very concerned: 58% (GOP: 47% | Independents: 61% | Dems: 70%)
- Somewhat concerned: 24% (GOP: 28% | Independents: 24% | Dems: 18%)
- Not too concerned: 8% (GOP: 12% | Independents: 2% | Dems: 5%)
- Not at all concerned: 9% (GOP: 10% | Independents: 11% | Dems: 6%)
…gun violence?
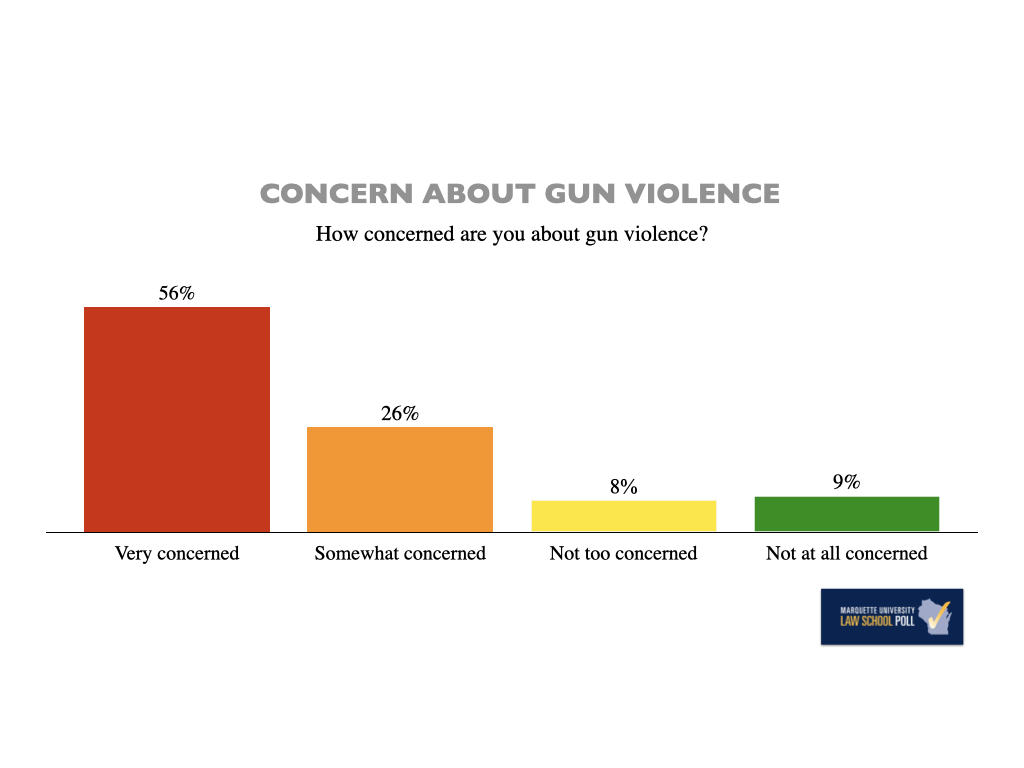
- Very concerned: 56% (GOP: 34% | Independents: 42% | Dems: 85%)
- Somewhat concerned: 26% (GOP: 34% | Independents: 51% | Dems: 12%)
- Not too concerned: 8% (GOP: 13% | Independents: 4% | Dems: 3%)
- Not at all concerned: 9% (GOP: 18% | Independents: 3% | Dems: 0%)
…healthcare?
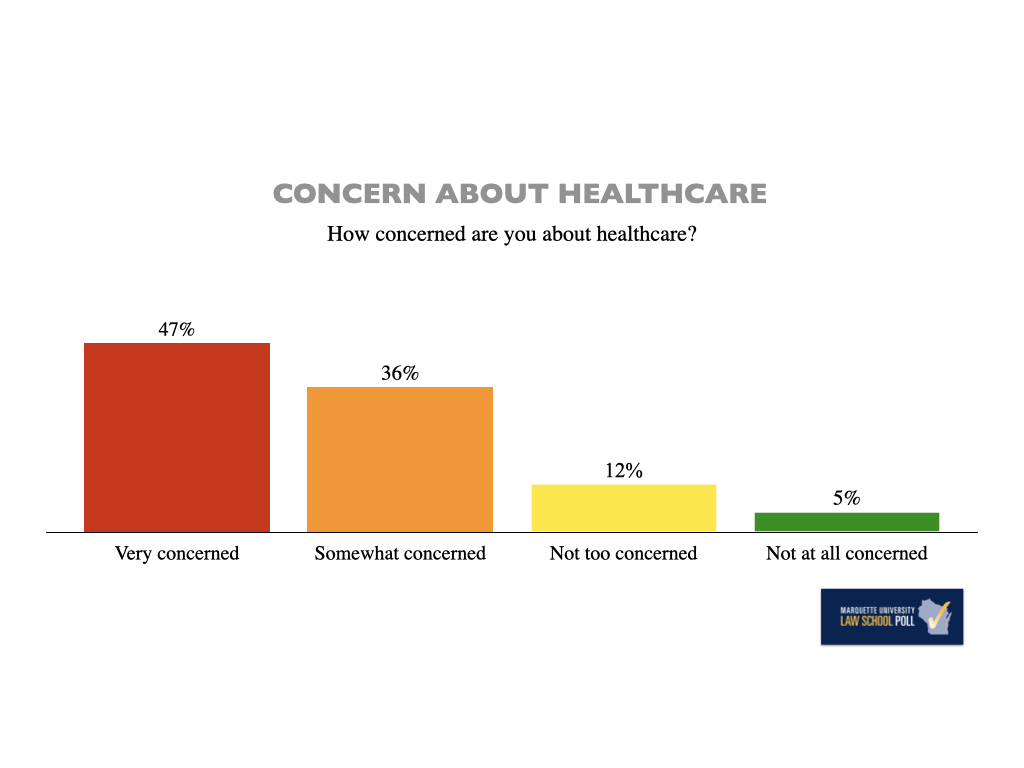
- Very concerned: 47% (GOP: 33% | Independents: 49% | Dems: 61%)
- Somewhat concerned: 36% (GOP: 44% | Independents: 40% | Dems: 26%)
- Not too concerned: 12% (GOP: 16% | Independents: 4% | Dems: 9%)
- Not at all concerned: 5% (GOP: 6% | Independents: 7% | Dems: 4%)
…Coronavirus?
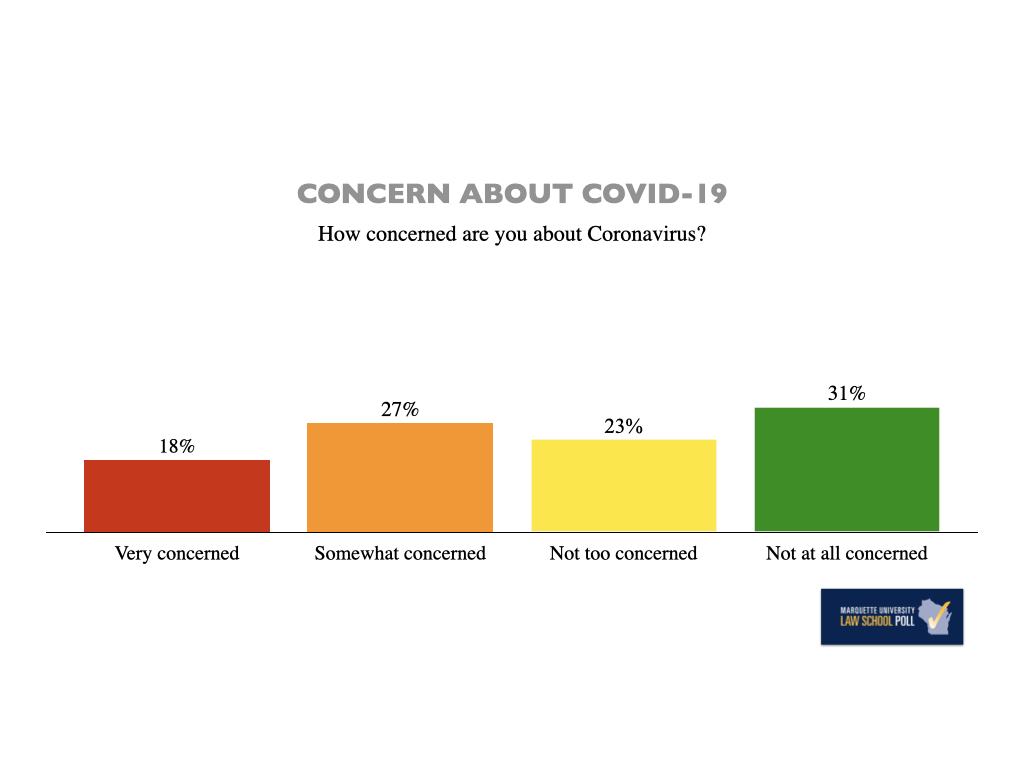
- Very concerned: 18% (GOP: 9% | Independents: 26% | Dems: 27%)
- Somewhat concerned: 27% (GOP: 17% | Independents: 19% | Dems: 40%)
- Not too concerned: 23% (GOP: 27% | Independents: 17% | Dems: 21%)
- Not at all concerned: 31% (GOP: 47% | Independents: 37% | Dems: 11%)
…PFAS contaminating your drinking water?
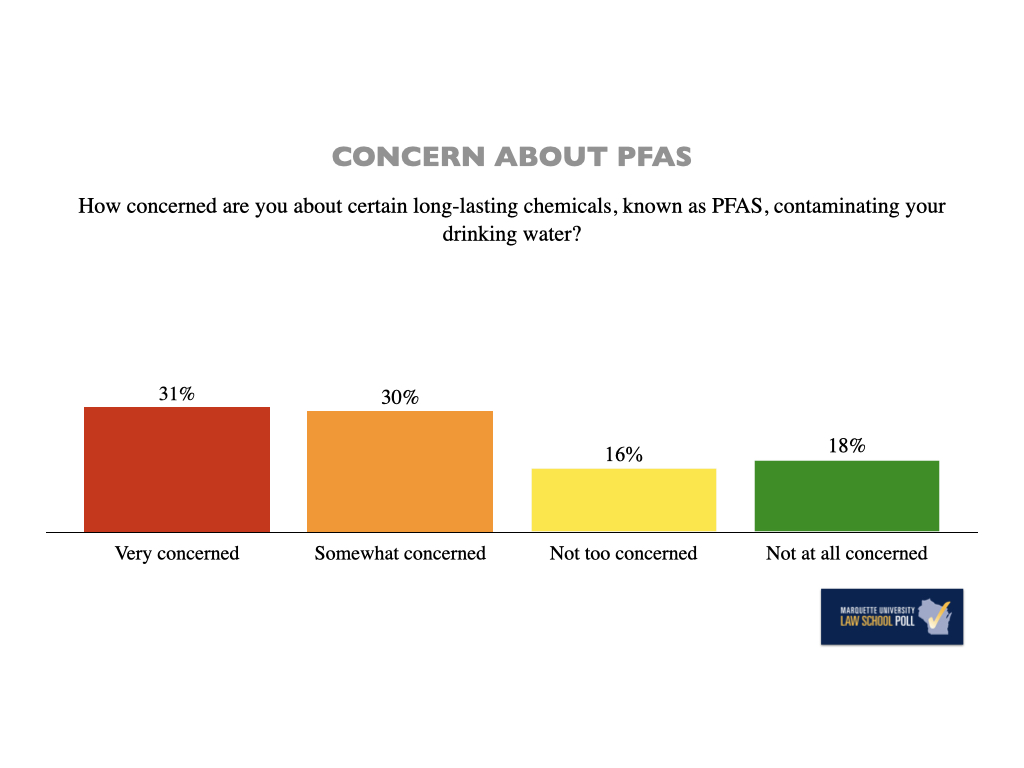
- Very concerned: 31% (GOP: 22% | Independents: 31% | Dems: 40%)
- Somewhat concerned: 30% (GOP: 28% | Independents: 36% | Dems: 31%)
- Not too concerned: 16% (GOP: 20% | Independents: 12% | Dems: 14%)
- Not at all concerned: 18% (GOP: 25% | Independents: 12% | Dems: 11%)
State Politics
 Governor Tony Evers
Governor Tony Evers Favorability +2%
- Favorability 44% (Was 47% in April poll)
- Unfavorability 42% (Was 42% in April poll)
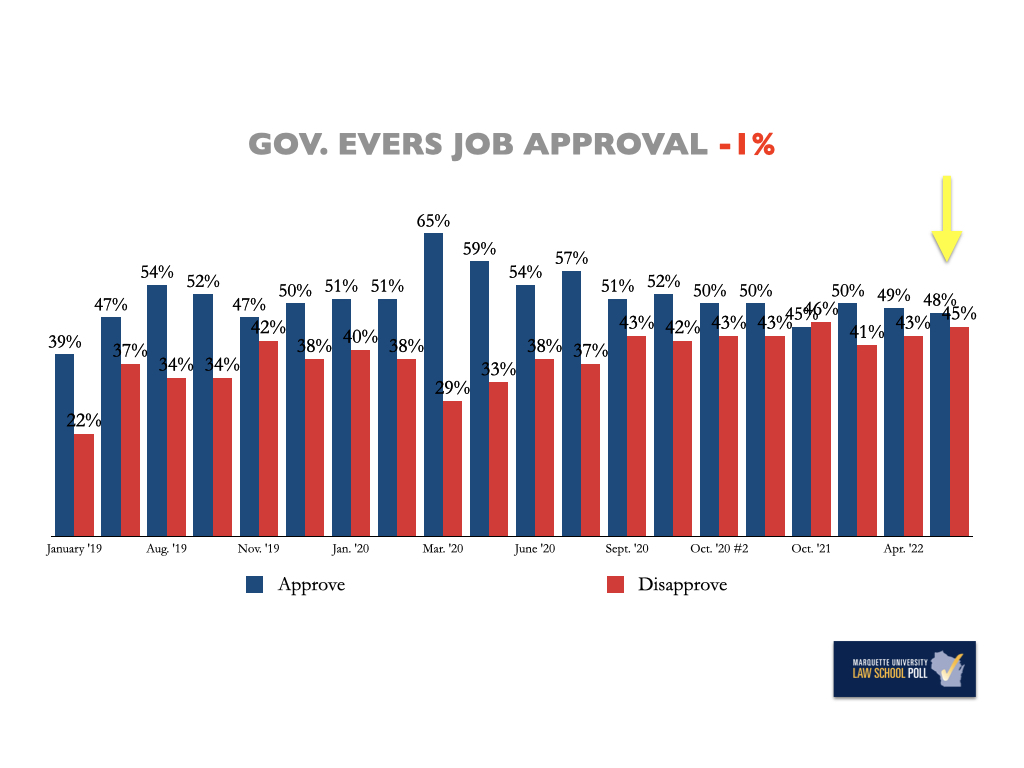
Governor Tony Evers Job Approval +3%
- 48% Approve (Was 49% in April poll)
- 45% Disapprove (Was 43% in April poll)
Governor Tony Evers’ job approval has dropped with 48% of registered voters saying they approve of the job Governor Evers is doing and 45% saying they disapprove (+3% net approval). This is a negative 3-point swing since the April survey when 49% said they approved and 43% disapproved of the job Gov. Evers was doing (a net +6% approval).
When only looking at those with the most intense opinions, 25% of respondents said they strongly approved of the job Governor Evers was doing compared to 30% who said they strongly disapproved.
83% of Democrats and leaning Democrats said they approved of Evers, compared t0 44% of Independents and 15% of Republicans and leaning Republicans.
80% of Republicans and leaning Republicans said they disapproved of Evers, compared to 38% of Independents and 11% of Democrats and leaning Democrats.
Governor Evers’ personal favorability is nearly identical to his job approval, with 44% of registered voters saying they have a favorable opinion and 42% having an unfavorable opinion, for a net +2% favorability. This is a 3-point decrease from the April survey when Governor Evers had a net +5% favorability.
80% of Democrats and leaning Democrats said they had a favorable opinion of Evers, compared to 39% of independents and 10% of Republicans and leaning Republicans.
77% of Republicans and leaning Republicans said they had an unfavorable opinion of Evers, compared to 39% of independents and 6% of Democrats and leaning Democrats.
2022 Elections
August 9th Partisan Primary
This month’s poll provides a baseline look at the status of the Republican Primary for Governor and the Democratic Primary for US Senate. Two months out, the poll finds that 32% of registered voters who plan to vote in the Republican Primary don’t know who they will vote for nor do 36% of registered voters who plan on voting in the Democratic Primary.
Republican Primary for Governor
Republican respondents were asked whether the opinions they had of the candidates in the Republican Primary for Governor were favorable or unfavorable.
- Rebecca Kleefisch: 44% favorable | 10% unfavorable
- Tim Michels: 42% favorable | 7% unfavorable
- Kevin Nicholson: 27% favorable | 8% unfavorable
- Tim Ramthun: 7% favorable | 10% unfavorable
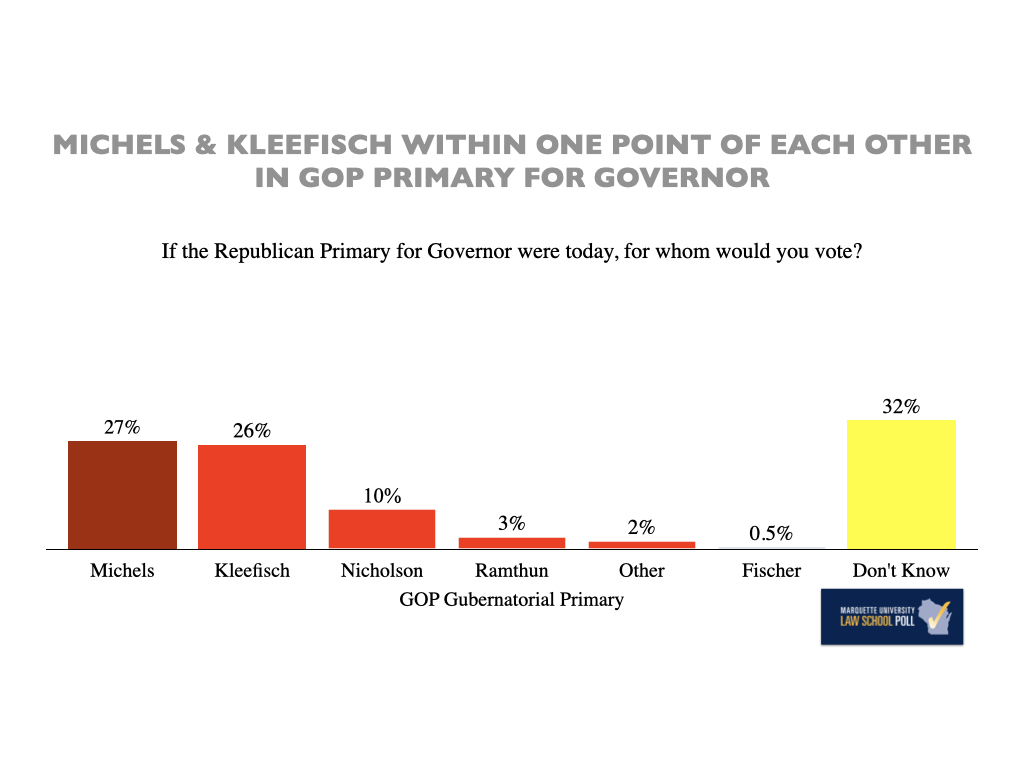
Republicans were asked about their preference in the Republican Primary for Governor:
- Tim Michels: 27%
- Rebecca Kleefisch: 26%
- Kevin Nicholson: 10%
- Tim Ramthun: 3%
- Someone else: 2%
- Adam Fischer: 0.5%
- Will not vote: 0%
According to the most recent poll, 26% of Republican Primary voters preferred Kleefisch compared to 32% in April, a 6% drop in support. That swing can likely be attributed to Michels’ entrance into the race shortly after the April 2022 poll was released.
32% said they didn’t know who they would vote for in the primary, a sharp decline from 46% who said they were unsure in April.
Note: 372 respondents, Margin of Error of +/- 6.3 percentage points
Democratic Primary for Senate
Democratic respondents were asked whether the opinions they had of the candidates in the Democratic Primary for Senate were favorable or unfavorable.
- Mandela Barnes: 41% favorable | 3% unfavorable
- Alex Lasry: 24% favorable | 7% unfavorable
- Sarah Godlewski: 31% favorable | 9% unfavorable
- Tom Nelson: 12% favorable | 8% unfavorable
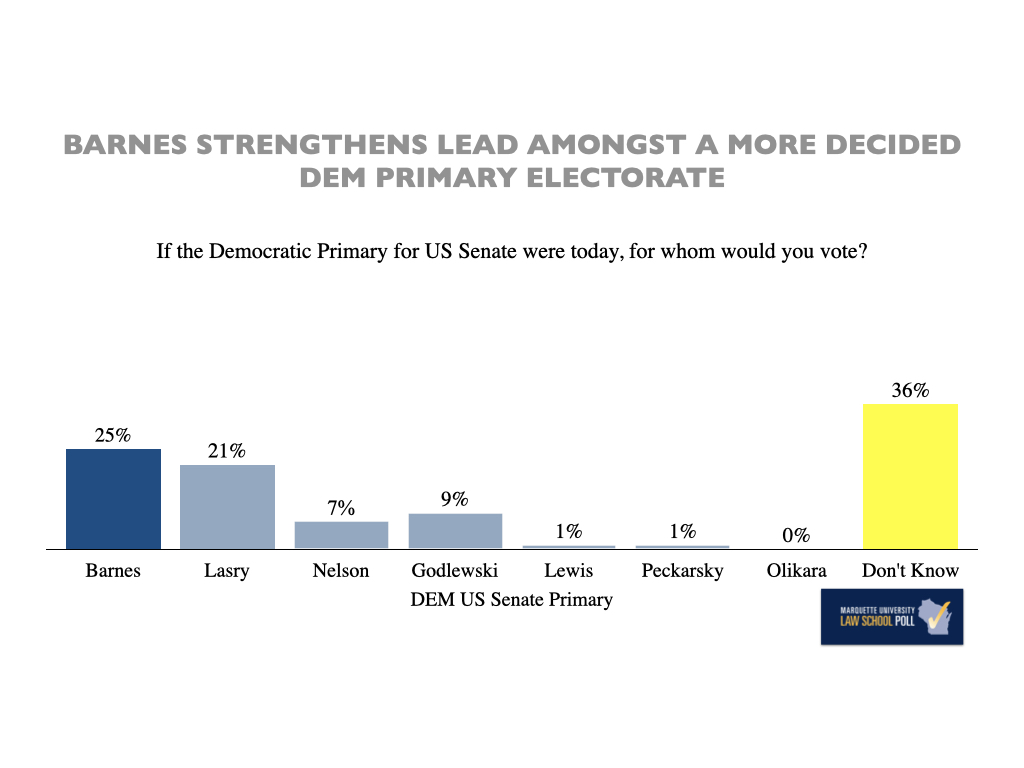
Democrats were asked about their preference in candidates for U.S. Senate:
- Mandela Barnes: 25%
- Alex Lasry: 21%
- Sarah Godlewski: 9%
- Tom Nelson: 7%
- Someone else: <1%
- Will not vote: 0%
June’s poll numbers reveal little change in the preferences of Democratic Primary voters other than a 12-point decrease in the number of Democratic Primary voters who say they don’t know who they will be voting for with the percentage dropping from 48% in April to 36% in June. Barnes’ lead over Lasry has remained steady; in April it was at 3% while the June poll has his lead at 4%.
Note: 369 respondents, Margin of Error of +/- 6.2 percentage points
Mock Match Ups
Evers vs. the GOP Primary Candidates:
Respondents were presented with hypothetical scenarios in which Tony Evers faced off against the various individual Republican gubernatorial candidates in a general election. If the candidates were Tony Evers and the following GOP Primary candidates, respondents said they would vote for the following:
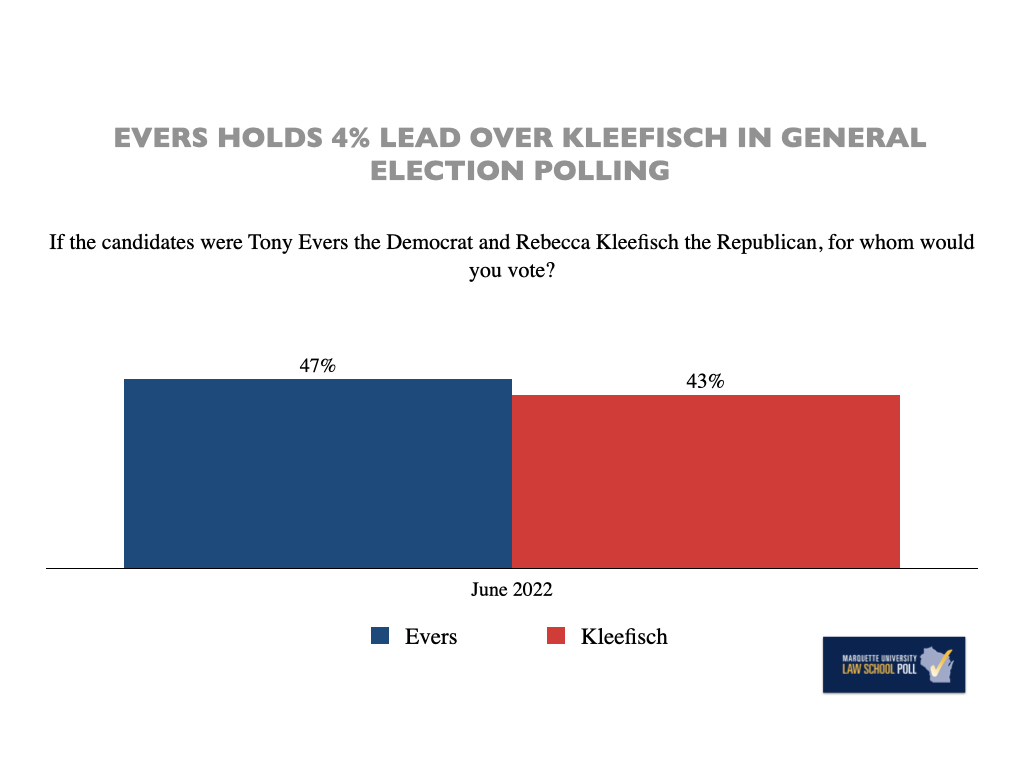
Tony Evers vs. Rebecca Kleefisch
- Tony Evers: 47%
- Rebecca Kleefisch: 43%
- Winner: Tony Evers +4%
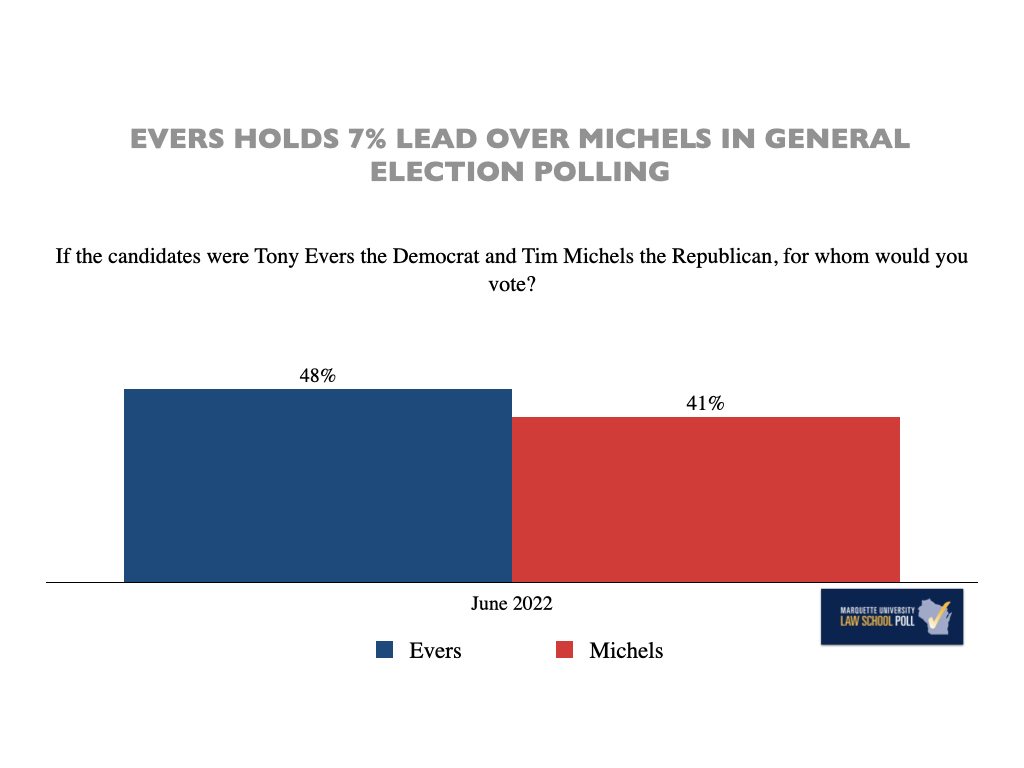
Tony Evers vs. Tim Michels
- Tony Evers: 48%
- Tim Michels: 41%
- Winner: Tony Evers +7%
Tony Evers vs. Kevin Nicholson
- Tony Evers: 48%
- Kevin Nicholson: 40%
- Winner: Tony Evers +8%
Tony Evers vs. Timothy Ramthun
- Tony Evers: 51%
- Timothy Ramthun: 34%
- Winner: Tony Evers +17%
State Issues
Right Direction-Wrong Track:
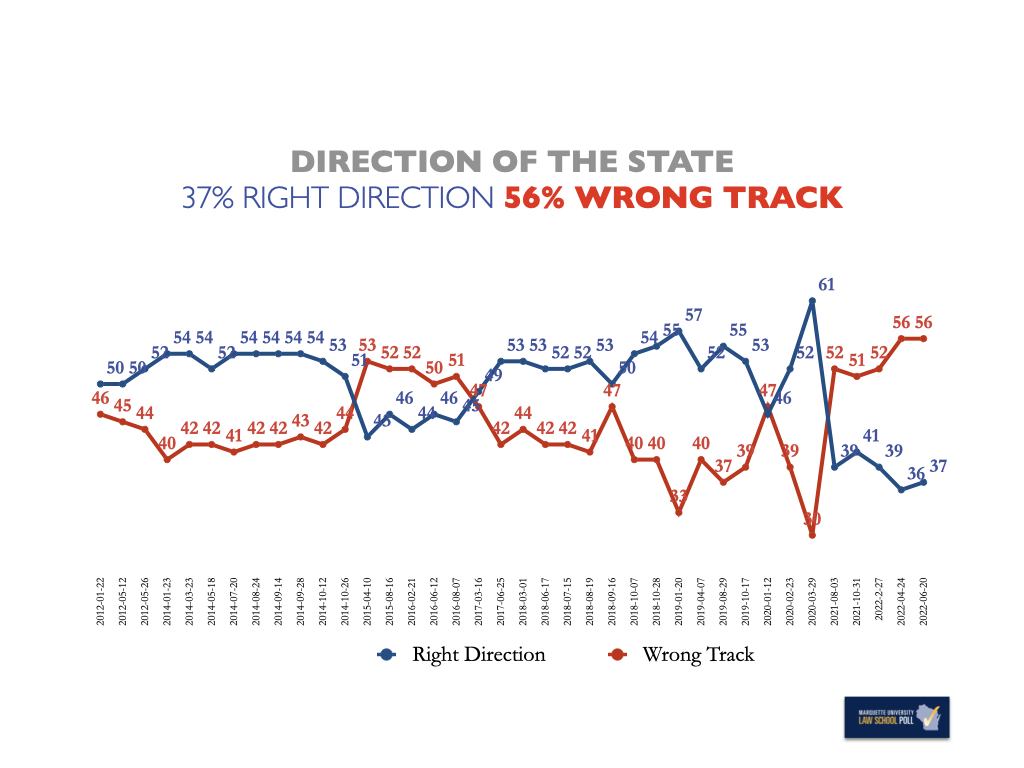
When asked “do you feel things in Wisconsin are generally going in the right direction, or do you feel things have gotten off on the wrong track?” 37% of registered voters said Wisconsin is going in the right direction and 56% said it is on the “wrong track.”
Views largely broke down along partisan lines:
- Republican/lean Republican: 18% right direction | 78% wrong track
- Democrat/lean Democrat: 58% right direction | 36% wrong track
- Independent: 40% right direction | 43% wrong track
In April 2022, 36% said that Wisconsin was going in the right direction and 56% said it was on the wrong track. Before the COVID-19 pandemic, 61% said it was going in the right direction and 30% said it was on the wrong track.
According to the poll, inflation remains the issue Wisconsin voters are most concerned about. 95% of registered voters said they were concerned about inflation.
Enthusiasm for Voting in November
58% of Democrats and 67% of Republicans said they were very enthusiastic about voting in the November 2022 election.


